This is a very short post for a summary of the blog post, I will make a quick function for myself to graph some area under the curve for convenience.
- Create your own function
If like well-known curve, it is already defined in R such as dnorm, otherwise you can define your own function.
For simplicity, I will only use standard normal (dnorm) (may update in the future).
I will try to make customized function in the furture.
library(ggplot2)
auc <- function(limit, lower.tail = TRUE, between = TRUE){
  bound <- c(-3.8, 3.8)
  n <- length(limit)
  if (n == 1){
    if (lower.tail){
      p <- ggplot(data = NULL, aes(bound)) +
        geom_area(stat = "function", fun = dnorm, fill = "#386890", xlim = c(-3.5, limit), alpha = .75) +
        geom_area(stat = "function", fun = dnorm, fill = "grey80", xlim = c(limit, 3.5), alpha = .75)
    } else {
      p <- ggplot(data = NULL, aes(bound)) +
        geom_area(stat = "function", fun = dnorm, fill = "grey80", xlim = c(-3.5, limit), alpha = .75) +
        geom_area(stat = "function", fun = dnorm, fill = "#386890", xlim = c(limit, 3.5), alpha = .75)
    }
  }
  if (n == 2) {
    lower <- limit[1]
    upper <- limit[2]
    if (between){
      p <- ggplot(data = NULL, aes(bound)) +
        geom_area(stat = "function", fun = dnorm, fill = "#386890", xlim = c(lower, upper), alpha = .75) +
        geom_area(stat = "function", fun = dnorm, fill = "grey80", xlim = c(-3.5, lower), alpha = .75) +
        geom_area(stat = "function", fun = dnorm, fill = "grey80", xlim = c(upper, 3.5), alpha = .75)
    } else {
      p <- ggplot(data = NULL, aes(bound)) +
        geom_area(stat = "function", fun = dnorm, fill = "grey80", xlim = c(lower, upper), alpha = .75) +
        geom_area(stat = "function", fun = dnorm, fill = "#386890", xlim = c(-3.5, lower), alpha = .75) +
        geom_area(stat = "function", fun = dnorm, fill = "#386890", xlim = c(upper, 3.5), alpha = .75)

    }
  }
  p <- p + theme_bw() + labs(x = "Z-score", y = "Density") + scale_x_continuous(breaks = limit) +
    theme(panel.grid.major = element_blank(), panel.grid.minor = element_blank())
  return(p)
}
Testing our function
# test
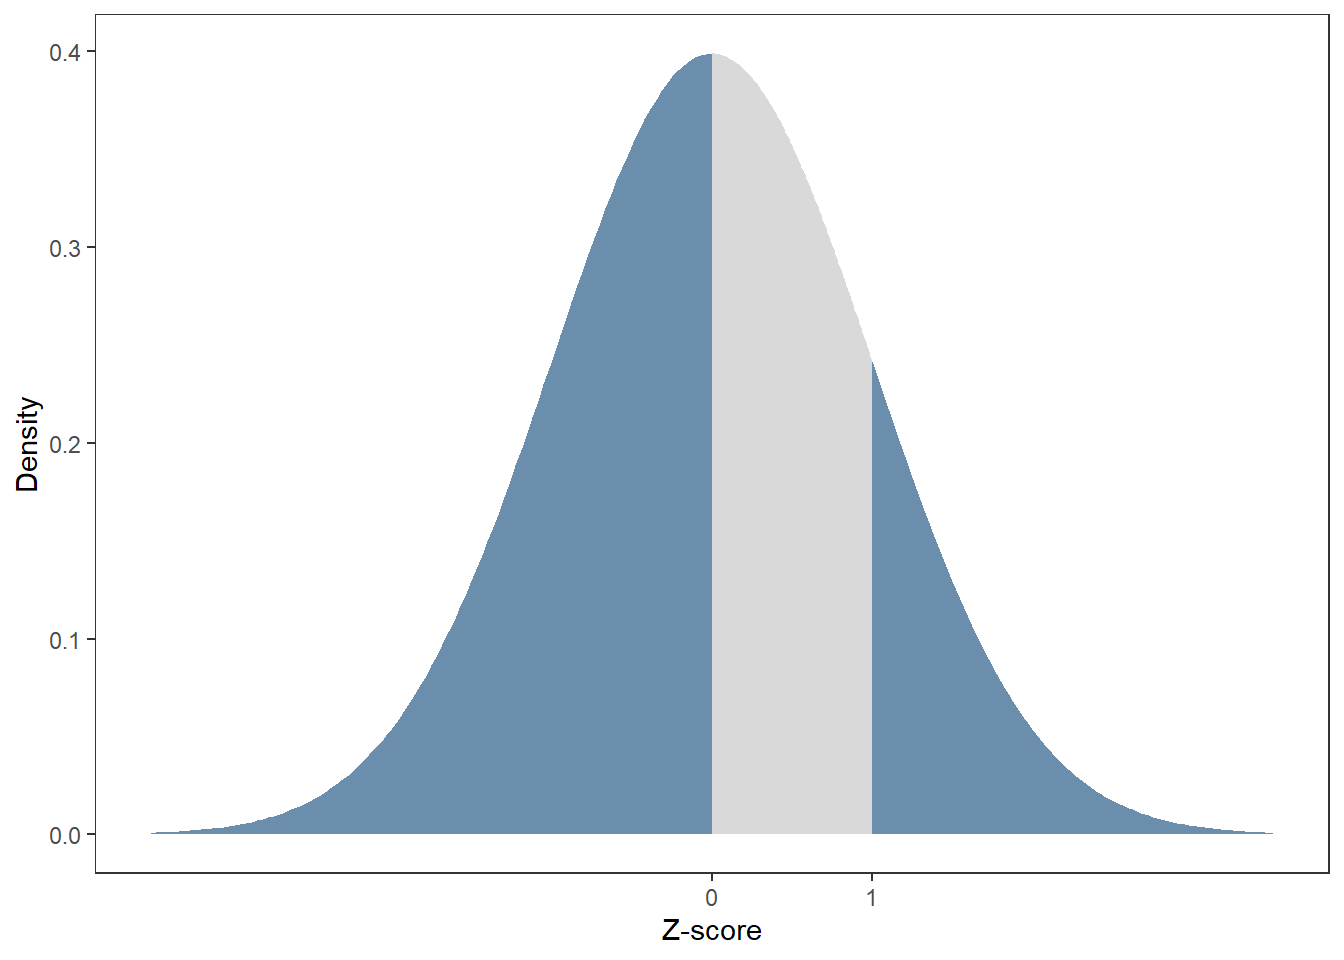
auc(1)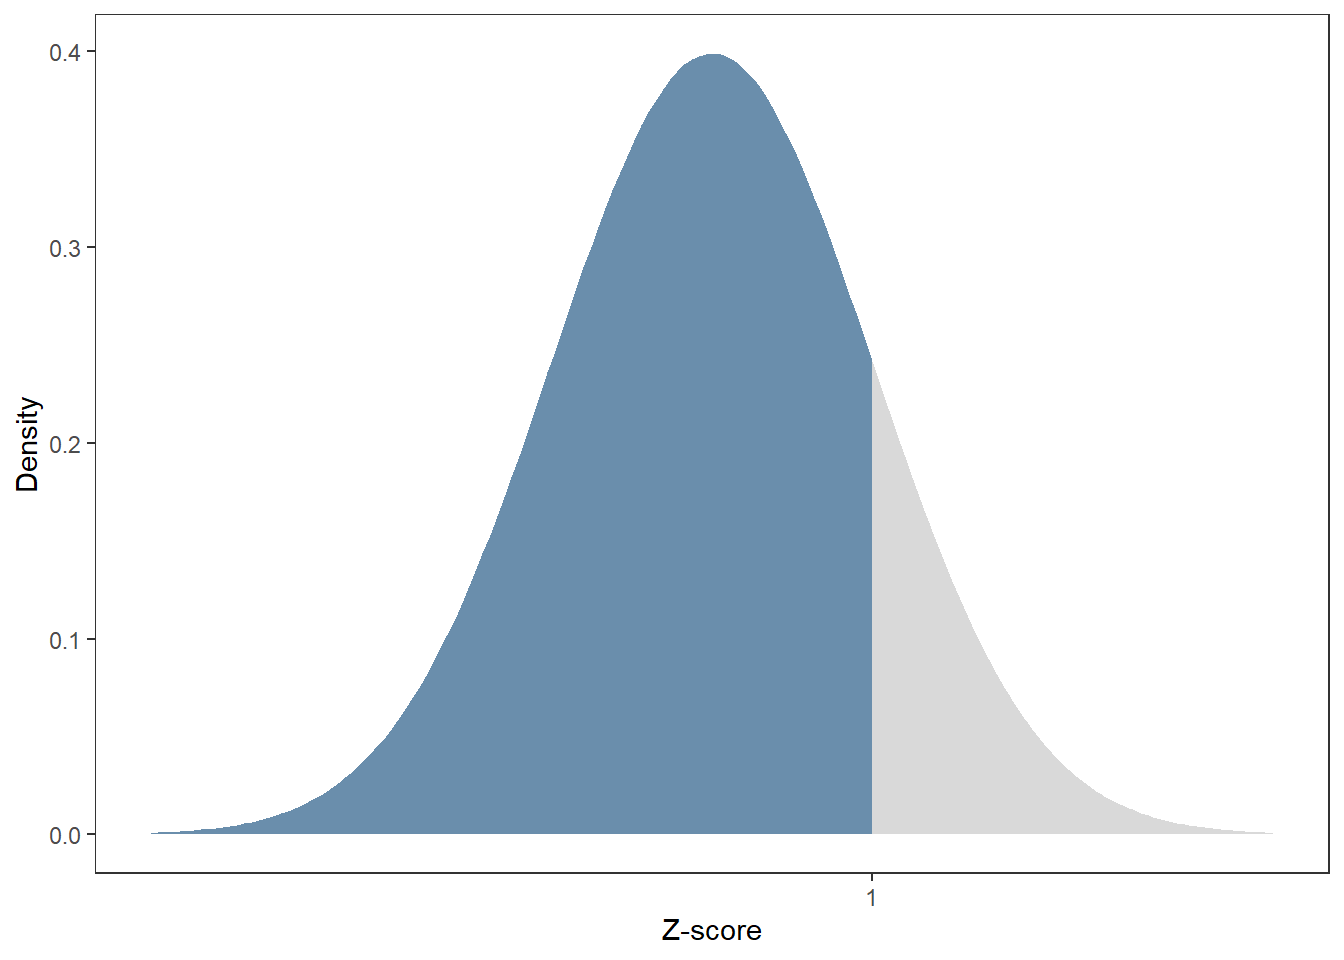
auc(1, lower.tail = F)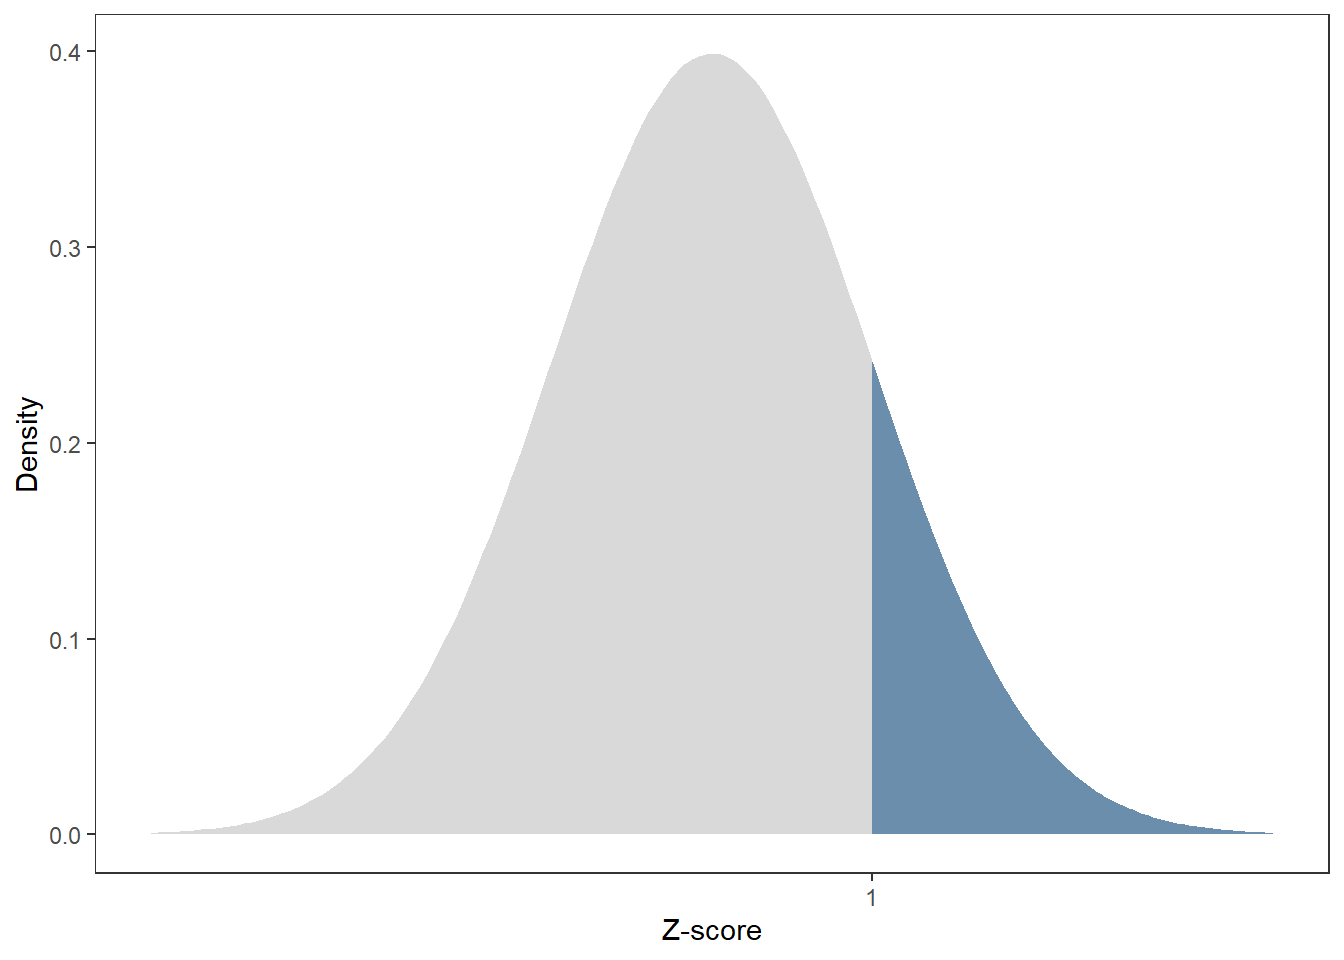
auc(c(0,1))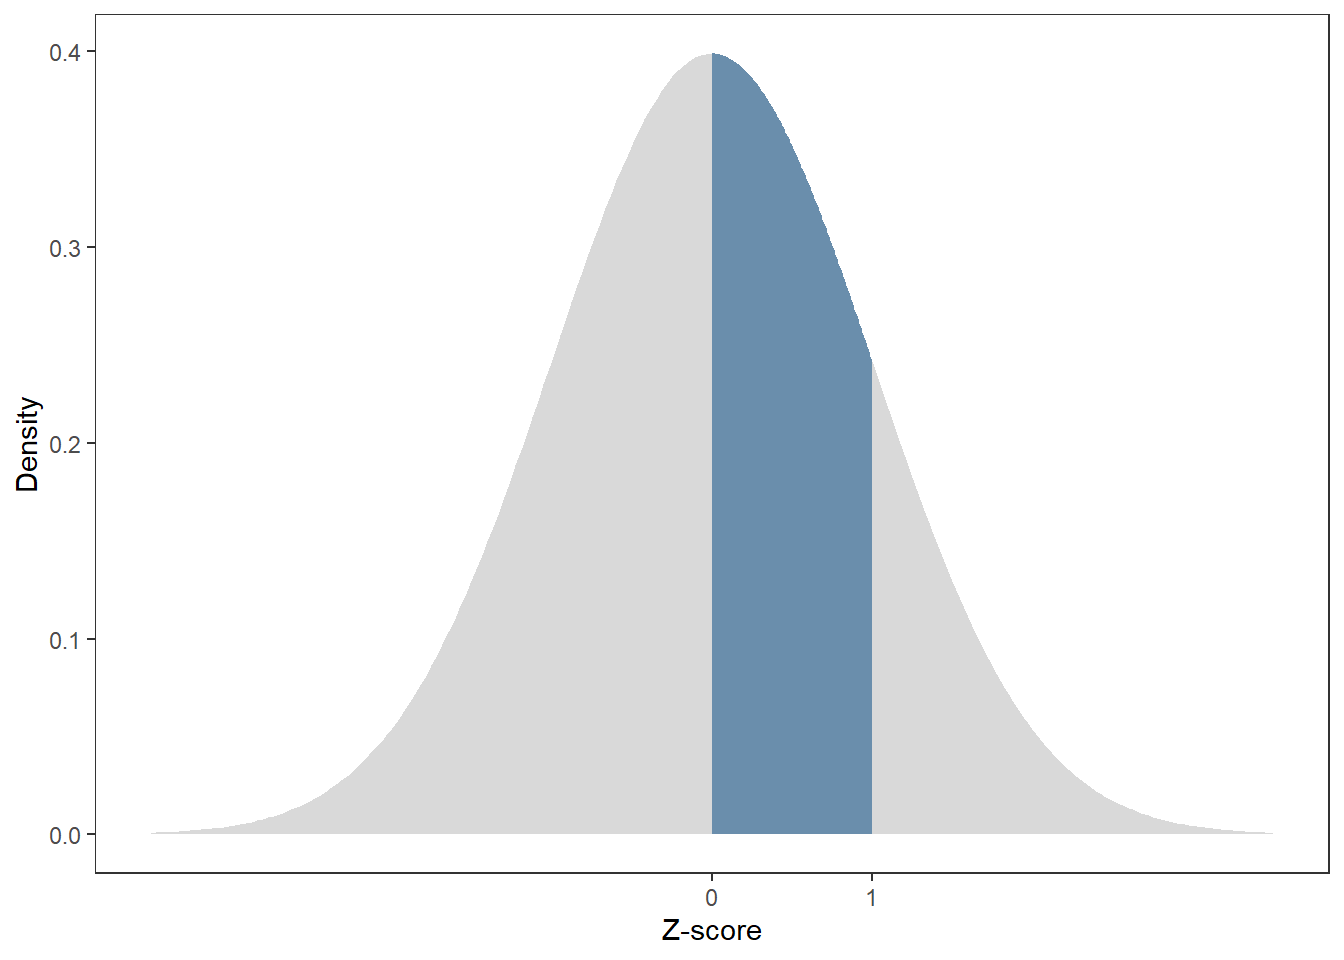
auc(c(0,1),between = F)