As I am going to get my first dose next week, I would like have some ideas about the safety of the vaccine. In Canada, AstraZeneca (AZ) and Pfizer are delivered. But recently, AZ are no longer suggested in province like Quebec and Ontario. I am going to use the available data on US.
Vaccination in US
And vaccinations data are available on Our World in Data.
The code for manipulations are as follows, but I imputed some missing data by linear interpolation.
library(lubridate)
library(dplyr)
library(ggplot2)
library(zoo)

vax_us <- readr::read_csv('us_state_vaccinations.csv')

vax_us <- vax_us %>%
  select(location, date, pvax = people_vaccinated, fvax = people_fully_vaccinated) %>%
  mutate(pvax = replace_na(pvax, 0), fvax = replace_na(fvax, 0)) %>%
  group_by(date) %>%
  summarise(pvax = sum(pvax), fvax = sum(fvax)) %>%
  mutate(pvax = na_if(pvax, 0), fvax = na_if(fvax, 0))

vax_us$fvax[1:21] <- 0
vax_us$pvax[1] <- 0

# some interpolation for the missing data.
vax_us <- vax_us %>% select(date, pvax, fvax) %>%
  mutate(pvax = round(na.approx(pvax), 0), fvax = round(na.approx(fvax), 0))

p_vax <- ggplot(data = vax_us) + theme_bw() + xlab('') + ylab('Population') +
  geom_area(aes(x = date, y = pvax), alpha = .7, fill = 'steelblue3') +
  geom_area(aes(x = date, y = fvax), alpha = .7, fill = 'seagreen') +
  scale_y_continuous(breaks = seq(0, 3*10^8, by = 10^8), labels = c(0, paste0(c(100, 200, 300), 'M'))) +
  ggtitle('US Vaccination') +
  theme(legend.title = element_blank(), legend.position = 'none', plot.title = element_text(hjust = .5))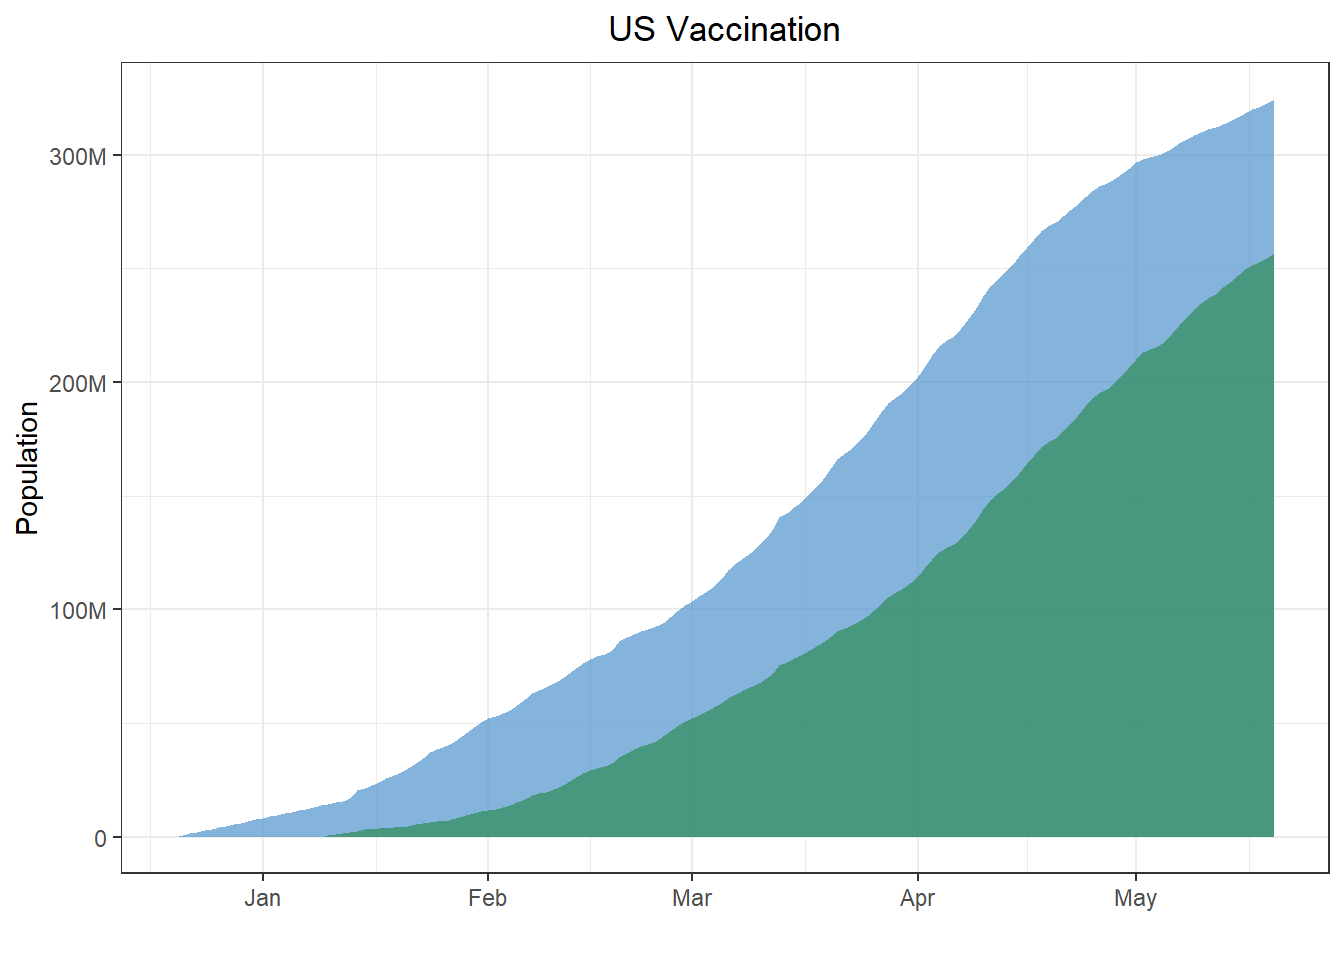
VARES in US
The data is available from CDC VARES (Vaccine Adverse Event Reporting System), note that there is some delay on the data and the report is subjective to the doctor, in other words, not every adverse cases will report immediately. US start vaccination since December 14th, 2020. Hence, I will combine the data from 2020 - 2021 to find all adverse cases on COVID vaccine. Until this post, the last date of the report is on May 6th, 2021.
library(dplyr)
library(tidyr)
library(readr)
library(stringr)
# reading data
X2021VAERSDATA <- read_csv("2021VAERSDATA.csv",
col_types = cols(RECVDATE = col_date(format = "%m/%d/%Y"),
CAGE_YR = col_skip(), CAGE_MO = col_skip(),
RPT_DATE = col_skip(), SYMPTOM_TEXT = col_skip(),
DATEDIED = col_date(format = "%m/%d/%Y"),
L_THREAT = col_logical(), VAX_DATE = col_date(format = "%m/%d/%Y"),
ONSET_DATE = col_date(format = "%m/%d/%Y"),
LAB_DATA = col_skip(), V_ADMINBY = col_skip(),
V_FUNDBY = col_skip(), OTHER_MEDS = col_skip(),
CUR_ILL = col_skip(), HISTORY = col_skip(),
SPLTTYPE = col_skip(), FORM_VERS = col_skip(),
TODAYS_DATE = col_skip(), BIRTH_DEFECT = col_skip(),
OFC_VISIT = col_skip(), ER_ED_VISIT = col_skip(),
ALLERGIES = col_skip()))
X2020VAERSDATA <- read_csv("2020VAERSDATA.csv",
col_types = cols(RECVDATE = col_date(format = "%m/%d/%Y"),
CAGE_YR = col_skip(), CAGE_MO = col_skip(),
RPT_DATE = col_skip(), SYMPTOM_TEXT = col_skip(),
DATEDIED = col_date(format = "%m/%d/%Y"),
L_THREAT = col_logical(), VAX_DATE = col_date(format = "%m/%d/%Y"),
ONSET_DATE = col_date(format = "%m/%d/%Y"),
LAB_DATA = col_skip(), V_ADMINBY = col_skip(),
V_FUNDBY = col_skip(), OTHER_MEDS = col_skip(),
CUR_ILL = col_skip(), HISTORY = col_skip(),
SPLTTYPE = col_skip(), FORM_VERS = col_skip(),
TODAYS_DATE = col_skip(), BIRTH_DEFECT = col_skip(),
OFC_VISIT = col_skip(), ER_ED_VISIT = col_skip(),
ALLERGIES = col_skip()))
X2020VAERSSYMPTOMS <- read_csv("2020VAERSSYMPTOMS.csv",
col_types = cols(SYMPTOMVERSION1 = col_skip(),
SYMPTOMVERSION2 = col_skip(), SYMPTOMVERSION3 = col_skip(),
SYMPTOMVERSION4 = col_skip(), SYMPTOMVERSION5 = col_skip()))
X2021VAERSSYMPTOMS <- read_csv("2021VAERSSYMPTOMS.csv",
col_types = cols(SYMPTOMVERSION1 = col_skip(),
SYMPTOMVERSION2 = col_skip(), SYMPTOMVERSION3 = col_skip(),
SYMPTOMVERSION4 = col_skip(), SYMPTOMVERSION5 = col_skip()))
X2021VAERSVAX <- read_csv("2021VAERSVAX.csv",
col_types = cols(VAX_NAME = col_skip(), VAX_ROUTE = col_skip()))
X2020VAERSVAX <- read_csv("2020VAERSVAX.csv",
col_types = cols(VAX_NAME = col_skip(), VAX_ROUTE = col_skip()))
VAERS_DATA <- bind_rows(X2020VAERSDATA, X2021VAERSDATA)
VAERS_VAX <- bind_rows(X2020VAERSVAX, X2021VAERSVAX)
VAERS_SYM <- bind_rows(X2020VAERSSYMPTOMS, X2021VAERSSYMPTOMS)
# filtering COVID vaccine (from VAERS_VAX) and join data
covid_vax <- VAERS_VAX %>%
filter(VAX_TYPE == 'COVID19') %>%
inner_join(VAERS_DATA, by = 'VAERS_ID') %>%
inner_join(VAERS_SYM, by = 'VAERS_ID')
vax_vaers <- covid_vax %>% select(VAX_MANU, AGE_YRS, SEX, DIED, DATEDIED, HOSPITAL)
vaers_info <- vax_vaers %>%
group_by(VAX_MANU, SEX) %>%
mutate(SEX = recode_factor(SEX, 'F' = 'Female', 'M' = 'Male')) %>%
mutate(DIED = replace_na(DIED, 'N'), HOSPITAL = replace_na(HOSPITAL, 'N'),
AGE_YRS = replace_na(AGE_YRS, 999)) %>%
mutate(DIED = as.factor(DIED), HOSPITAL = as.factor(HOSPITAL),
SEX = as.factor(SEX), AGE_YRS = cut(AGE_YRS, breaks = c(0, seq(19, 79, by = 10), 129, Inf))) %>%
mutate(VAX_MANU = str_replace_all(VAX_MANU, 'PFIZER\\\\BIONTECH', 'PFIZER')) %>%
mutate(VAX_MANU = str_replace_all(VAX_MANU, 'UNKNOWN MANUFACTURER', 'UNKNOWN'))
color_manu <- c('seagreen','firebrick3','steelblue3', 'grey')
library(ggplot2)
p <- ggplot(data = vaers_info %>% filter(SEX != 'U' & VAX_MANU != 'UNKNOWN')) + theme_bw() +
theme(legend.title = element_blank(),
legend.position = 'none',
plot.title = element_text(hjust = .5))
p_vare <- p + geom_bar(aes(x = AGE_YRS, fill = VAX_MANU), width = .5) + scale_fill_manual(values = color_manu) +
scale_x_discrete(labels = c(levels(vaers_info$AGE_YRS)[1:7], '80+', 'unknown'),
guide = guide_axis(check.overlap = TRUE)) +
xlab('Age Groups') + ylab('Frequency') + ggtitle('US Vaccine Adverse Effect') +
facet_grid(rows = vars(SEX), cols = vars(VAX_MANU))
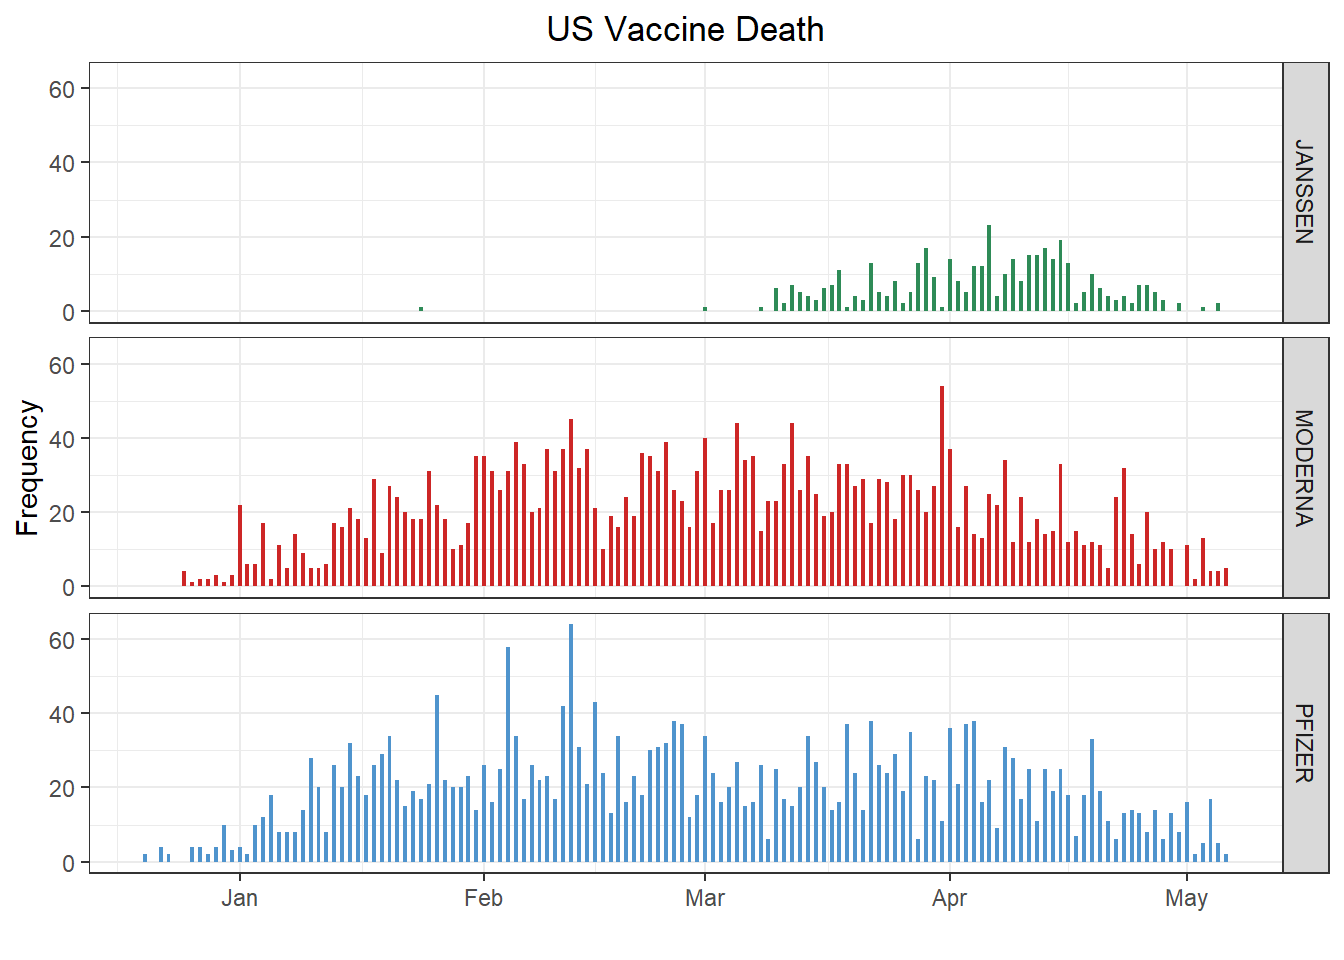
p_death <- ggplot(vaers_info %>% filter(DATEDIED > '2020-12-14' & SEX != 'U' & VAX_MANU != 'UNKNOWN')) +
geom_bar(aes(x = DATEDIED, fill = VAX_MANU), width = .5) + xlab('') + ylab('Frequency') +
ggtitle('US Vaccine Death') +
scale_fill_manual(values = color_manu) + facet_grid(rows = vars(VAX_MANU)) + theme_bw() +
theme(legend.title = element_blank(),
legend.position = 'none',
plot.title = element_text(hjust = .5))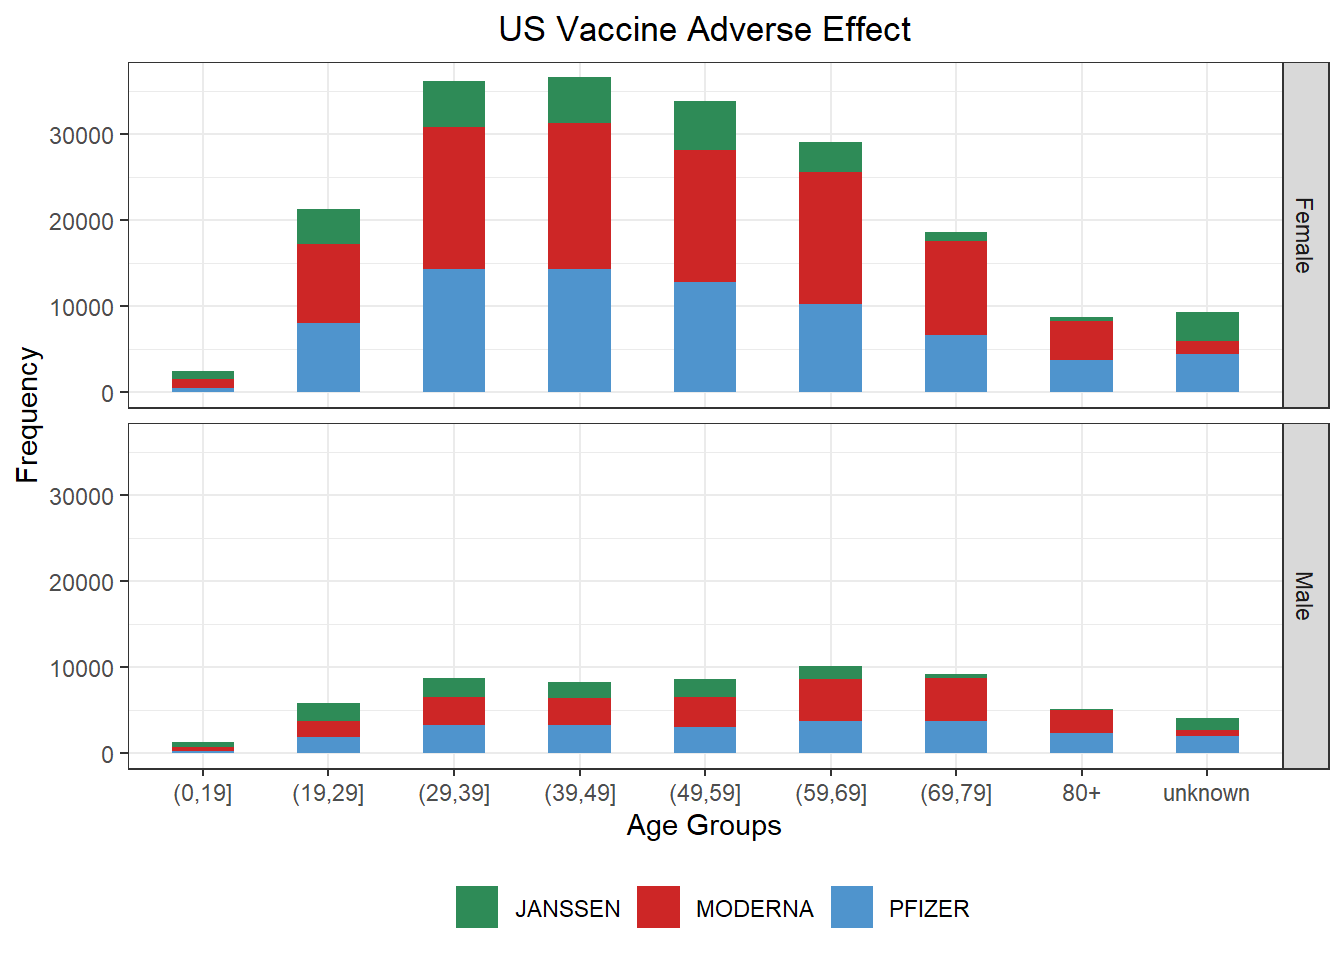
A table of relationship among manufactures, gender, hospitalization and death are listed below. Better representation are under consideration.
library(DT)

tbl <- vaers_info %>%
  mutate(VAX_MANU = as.factor(VAX_MANU)) %>%
  select(VAX_MANU, SEX, HOSPITAL, DIED) %>%
  filter(SEX != 'U') %>%
  filter(VAX_MANU != 'UNKNOWN') %>%
  group_by(VAX_MANU, SEX, HOSPITAL, DIED) %>%
  summarise(Frequency = n())

datatable(tbl, filter = 'top', rownames = FALSE, options = list(pageLength = 24, autoWidth = TRUE))